
Binary Options Money Management: Position Sizing Approaches (2026)


Capital is at risk. Position sizing in binary options determines whether an account survives long enough for a trader's analytical approach to be empirically evaluated. This article documents the structural mathematics of position sizing in binary options, the practical formulas, the relationship between drawdown and recovery, and the session-level limits that materially affect outcome distributions for UAE residents.
Risk warning
The UAE Capital Market Authority (CMA, successor to the SCA from 1 January 2026 under Federal Decree-Laws 32 and 33 of 2025), the Dubai Financial Services Authority (DFSA), and the Financial Services Regulatory Authority (FSRA) of ADGM have not authorised any binary options broker for retail clients. Position sizing practices documented here may reduce the speed and magnitude of losses but do not change the underlying retail-outcome distribution documented by ASIC at 74–80% net loss-making. Treat position sizing as the operational discipline that determines whether the account survives long enough for the trader's approach to be evaluated empirically, not as a profitability technique.
The core question of position sizing
The substantive question is straightforward: how much of the account should be at risk on any single trade, and how does that figure relate to the typical losing streaks the trader can expect to encounter?
The answer is determined by the relationship between three variables: the trader's per-trade risk percentage, the expected length and frequency of losing streaks, and the drawdown the account can absorb without becoming behaviourally compromised.
For UAE residents using offshore binary options brokers, position sizing is the most direct lever available to manage risk. Other dimensions of risk — broker counterparty risk, payout policy, regulatory standing — are largely outside the trader's direct control once the broker is selected. Position sizing remains within the trader's control on every trade and over time accounts for the largest share of variation in retail outcomes.
Position sizing should be selected in advance based on the account's capacity to absorb expected losing streaks, then maintained through capital pressure and behavioural strain. Adjustments made in response to recent results — increasing after losses to "recover," increasing after wins from "confidence" — are the principal pattern of position-sizing failure.
The mathematics of drawdown and recovery
The single most important position-sizing principle is the asymmetry between drawdown and required recovery. The relationship is structural and produces sharp consequences for excessive position sizing.
Recovery requirements at common drawdown levels
| Drawdown | Subsequent gain required to return to breakeven |
|---|---|
| 10% | 11.1% |
| 20% | 25.0% |
| 30% | 42.9% |
| 40% | 66.7% |
| 50% | 100.0% |
| 60% | 150.0% |
| 70% | 233.3% |
| 80% | 400.0% |
| 90% | 900.0% |
Drawdown after consecutive losses by per-trade risk
| Per-trade risk | After 5 losses | After 10 losses | After 15 losses | After 20 losses |
|---|---|---|---|---|
| 1% | 4.9% | 9.6% | 14.0% | 18.2% |
| 2% | 9.6% | 18.3% | 26.1% | 33.2% |
| 3% | 14.1% | 26.3% | 36.7% | 45.6% |
| 5% | 22.6% | 40.1% | 53.7% | 64.2% |
| 10% | 41.0% | 65.1% | 79.4% | 87.8% |
| 15% | 55.6% | 80.3% | 91.2% | 96.1% |
| 20% | 67.2% | 89.3% | 96.5% | 98.8% |
- At 1–2% per trade risk: Even substantial losing streaks (15–20 consecutive losses) produce drawdowns that are recoverable through subsequent winning streaks. Account survival is mathematically feasible.
- At 5% per trade risk: A 15–20 loss streak produces drawdowns of 54–64%, requiring 117–178% subsequent gains to recover.
- At 10% per trade risk: A 15-loss streak produces a 79% drawdown, requiring a 376% subsequent gain to recover. Statistically improbable for retail traders and effectively account loss.
- At 20% per trade risk: A 10-loss streak produces an 89% drawdown. The account is mathematically unrecoverable through normal trading.
The widely cited 1–2% per-trade convention is not arbitrary. It reflects the empirical observation that retail traders' typical losing streaks (10–15 consecutive losses are common) produce drawdowns under this rule that allow continued trading and eventual recovery.
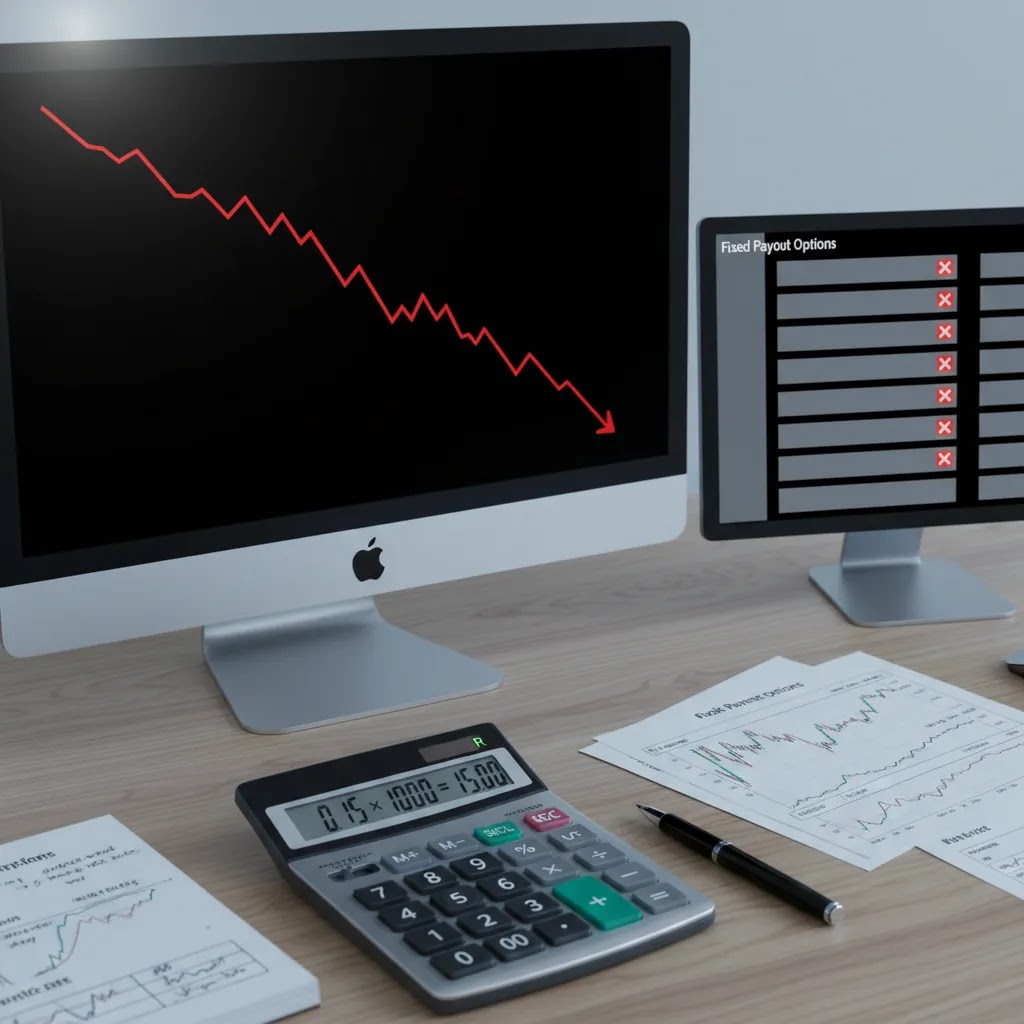
Break-even mathematics interaction with position sizing
Break-even win rate by realised payout
| Realised average payout | Break-even win rate required |
|---|---|
| 70% | 58.8% |
| 75% | 57.1% |
| 80% | 55.6% |
| 85% | 54.1% |
| 90% | 52.6% |
Position sizing affects the speed of capital depletion at any given win rate but does not change the break-even threshold. A trader with a 50% win rate at 80% payouts loses approximately 10% per trade on average regardless of position sizing — but the speed of cumulative loss varies by position size.
Trades to lose 50% of account at 50% win rate, 80% payout
| Per-trade risk | Trades to lose 50% |
|---|---|
| 1% | ~70 trades |
| 2% | ~35 trades |
| 5% | ~14 trades |
| 10% | ~7 trades |
| 20% | ~3–4 trades |
Smaller position sizes produce slower capital depletion. The slower depletion provides more time to identify that the strategy is loss-making at the broker's realised payouts, stop trading before substantial capital is lost, adjust the approach if a different strategy might be profitable, and withdraw remaining capital before broker-related issues develop.
Position sizing is not just risk management but also empirical evaluation infrastructure. A trader using 1% per-trade risk has substantially more time to evaluate whether their approach is mathematically viable than a trader using 5% per-trade risk.
Position sizing models — practical implementation
Fixed percentage of account equity
Formula: Stake = current account balance × per-trade risk percentage. Example: $750 account, 1.5% per-trade risk = $11.25 stake.
- Stake automatically decreases during drawdowns, reducing further compounding
- Stake automatically increases during winning periods, allowing modest compounding
- Mathematical relationship between drawdown and recovery is well-characterised
- Implementation is simple and auditable
- Caveat: some brokers have minimum trade sizes ($1, $5, or $10) that may force higher percentage risk on small accounts
Fixed dollar amount
The trader uses the same stake on every trade regardless of account fluctuation. Effective per-trade risk percentage rises during drawdowns (since the same dollar amount is a larger percentage of a smaller account). The rising effective risk during drawdowns is the principal failure mode — accounts that lose 20% suddenly have 25% higher per-trade risk on subsequent trades. Generally inappropriate except as an early-stage simplification.
Kelly Criterion (advanced, generally inadvisable for retail)
Formula: Optimal fraction = ((win rate × (payout + 1)) − 1) / payout. Example: 60% win rate, 80% payout = 0.10 (10% of account per trade).
- Assumes accurate knowledge of true win rate, which is not available for retail traders
- "Full Kelly" sizing typically produces 50% drawdowns at random intervals, which most retail traders cannot tolerate behaviourally
- "Half Kelly" or "Quarter Kelly" at retail confidence levels typically returns to the 1–2% range
- Not generally appropriate for retail binary options traders
Martingale and progression-based systems
Models that increase stake size after losses, intended to recover prior losses on the eventual win. A 10-trade losing streak requires stake size 1,024 times the original — typically beyond account size or broker limits. Reliably produces full account loss when the inevitable losing streak exceeds funding capacity. Not appropriate for retail binary options trading. Detailed treatment at Martingale Strategy in Binary Options.
Practical recommendation: fixed percentage of account equity at 1–2% per trade. Other models either require sophistication retail traders do not have (Kelly), have known structural failure modes (Martingale), or produce avoidable drawdowns (fixed dollar amount during downside periods).

Daily and weekly loss limits
- Daily loss limits. Cap daily losses at 4–6% of account capital. When the limit is hit, stop for the day. Compute the limit at the start of each session, do not deposit additional funds during the session, do not adjust the limit during the session.
- Loss-streak stops. Pause trading after consecutive losses (e.g., stop after 3 consecutive losses; stop for the day after 5 consecutive losses; pause 30 minutes after 4 consecutive losses).
- Weekly stops. Cap weekly losses at 10–15% of account capital. When hit, trading pauses for review.
- Trade frequency limits. Cap total trades per session (e.g., 5 trades per session, 10 per day) to enforce selective entries rather than reactive trading.
Composite limits — a practical structure:
- Per-trade: 1–2% of account
- Loss streak: stop after 3 consecutive losses
- Daily: stop after 4–6% drawdown or 5 trades, whichever comes first
- Weekly: review after 10–15% drawdown
- Monthly: comprehensive review of strategy and continuation decision
"Risk of ruin" — a useful framing
Risk of ruin describes the probability that a sequence of losses depletes the account to a point where continued trading is impractical. The concept is useful because it converts position sizing from an abstract risk management discussion into a concrete probability calculation.
Approximate probability of 50% drawdown over 200 trades (55% win rate, 80% payouts)
| Per-trade risk | Probability of 50% drawdown |
|---|---|
| 1% | <1% |
| 2% | <5% |
| 5% | ~25% |
| 10% | ~60% |
| 20% | ~90% |
Even traders with positive expected value face meaningful drawdown risk under aggressive position sizing. The 1–2% per-trade convention reduces drawdown probability to manageable levels; per-trade risk above 5% produces meaningful probability of severe drawdown even for profitable traders. Position sizing affects survival probability more than typical retail-level skill differences do.
Spreadsheet and tracking template
Per-trade record:
- Trade number (sequential)
- Date and time
- Asset
- Direction (call/put)
- Stake (absolute and percentage of current balance)
- Payout displayed at entry (verbatim from broker)
- Expiry length
- Entry rationale (one sentence — the specific setup or signal)
- Outcome (win/loss/at-the-money)
- Resulting balance
- Rule violation flag and which rule (yes/no)
The tracking should be implemented before any live trading, used during demo testing, and continued through live trading. The continuity of data across demo and live phases is informative about the trader's behavioural divergence between the two environments and supports honest evaluation.
Behavioural patterns that defeat position sizing
- Recovery escalation. After a loss, the trader increases stake size to recover the loss on the next trade. Reliably produces oversized losses when the recovery trade is also a loss.
- Overconfidence escalation. After a winning streak, the trader increases stake size. The subsequent reversion to mean produces oversized losses.
- The "this trade is special" exception. A trader committed to consistent sizing identifies a setup that "looks certain" and places it at increased size. Certainty in trading is the absence of discipline rather than its proof.
- Daily limit violations. A trader hits the daily loss limit and continues trading "just one more" to recover. Reliably produces additional losses.
- Time-based escalation. A trader who has not hit profit targets by mid-session begins trading more frequently or at larger size to "catch up."
- Substance and fatigue compromise. Trading under fatigue, illness, or substance influence consistently degrades decision quality.
- External pressure. Family financial pressure, account-manager outreach from the broker, or self-imposed pressure can push the trader to violate position-sizing rules.
Position-sizing rules defeated by behaviour are not defeated by trader incompetence but by trader humanity. Effective position sizing acknowledges these tendencies in advance and structures rules that constrain them, rather than relying on willpower to suppress them in the moment.

A simple money management plan template
Pre-trading commitments:
- Per-trade risk: 1.5% of current account balance
- Daily loss limit: 4% of starting-of-day balance
- Loss-streak stop: 3 consecutive losses
- Maximum trades per session: 5
- Weekly review threshold: 10% drawdown
- Asset focus: 1–2 major assets (e.g., EUR/USD, GBP/USD) during London-NY overlap (4:00 PM – 8:00 PM UAE time)
Per-trade procedure:
- Confirm current account balance
- Calculate stake size (balance × 1.5%, rounded down to whole-dollar amount)
- Verify the broker's displayed payout supports the trader's win rate (break-even threshold below documented win rate)
- Check that no session rule has been violated
- Place the trade and document it immediately
- Update running session tracker
Per-week procedure:
- Aggregate realised win rate and average payout
- Compare to break-even threshold at realised payout
- Note behavioural patterns observed
- Decide whether continuation is supported by the data
The template emphasises empirical evaluation over discretionary judgement. The trader is not deciding whether the strategy "feels right" but whether the documented data supports continuation.
Frequently asked questions
How much should a UAE resident risk per trade? 1–2% of account capital per trade is the widely cited convention. The convention reflects the empirical observation that this risk level allows even substantial losing streaks (15–20 consecutive losses) to produce drawdowns that are recoverable.
What is the difference between fixed percentage and fixed dollar position sizing? Fixed percentage uses the same percentage of current account balance on each trade. Fixed dollar uses the same dollar amount regardless of account fluctuation. Fixed percentage is preferable because it automatically reduces stake during drawdowns.
Should UAE residents use Martingale or progression sizing? No. Martingale produces reliable account loss when losing streaks exceed funding capacity. The system optimises for small frequent gains at the cost of catastrophic infrequent losses.
Can position sizing make binary options safe? No. Position sizing reduces the speed and magnitude of losses but does not change the underlying retail-outcome distribution. A trader following 1% per-trade discipline with a 50% win rate at 80% payouts is still loss-making at approximately 10% per trade on average.
What is the appropriate daily loss limit? Typical daily loss limits are 4–6% of account capital. The specific value matters less than the pre-commitment to stop when the limit is hit.
How do I know if I'm trading with too much money? If a single trade loss would meaningfully affect your emotional state for hours afterward, position size is too large. If the account's losses are visible to family members and producing tension, position size is too large. If you are monitoring open positions to the exclusion of work or other responsibilities, position size is too large.
What is the difference between money management and risk management? Money management typically refers specifically to position sizing, loss limits, and capital allocation decisions. Risk management is broader, including broker selection, due diligence, withdrawal planning, and behavioural pattern recognition. Detailed treatment at Binary Options Risk Management.
Will the new UAE CMA framework affect position sizing considerations? The CMA framework does not authorise binary options brokers for UAE retail clients. UAE residents trading through offshore brokers do so without UAE regulatory protections — which makes broker selection and conservative position sizing more important than under regulated alternatives.
Final risk warning
Position sizing is the operational discipline that determines whether a binary options account survives the documented retail-loss distribution long enough for the trader's approach to be empirically evaluated. ASIC documented 74–80% of retail clients as net loss-making, with aggregate net retail losses of approximately AU$14 million across five issuers in 13 months. Position sizing reduces the speed and magnitude of losses but does not change the underlying outcome distribution. Capital is at risk and total loss of deposit is a frequent outcome.
About the Author
Braden Chase is a trading specialist and former research specialist at Forex.com. He writes about market mechanics, trading instruments, and the regulatory landscape to help readers research financial markets with a clearer understanding of risk. Braden has previously served as a registered commodity futures representative for domestic and internationally-regulated brokerages. Articles are educational analysis and do not constitute investment advice. Binary options are high-risk speculative instruments and are not regulated in the UAE.