
Bollinger Bands Binary Options (2026)


The Bollinger Bands binary options approach is a volatility-based method that many traders use to judge whether price is stretched, consolidating, or preparing for expansion. For UAE traders, this can be useful because binary options decisions often depend on timing, short expiry selection, and whether current price movement is likely to continue or fade.
Risk warning
Binary options are not authorised for UAE retail clients by the CMA, DFSA, or FSRA. Capital is at risk on every trade. Bollinger Bands may help structure decisions, but they do not remove the possibility of fast losses.
What Bollinger Bands show in binary options
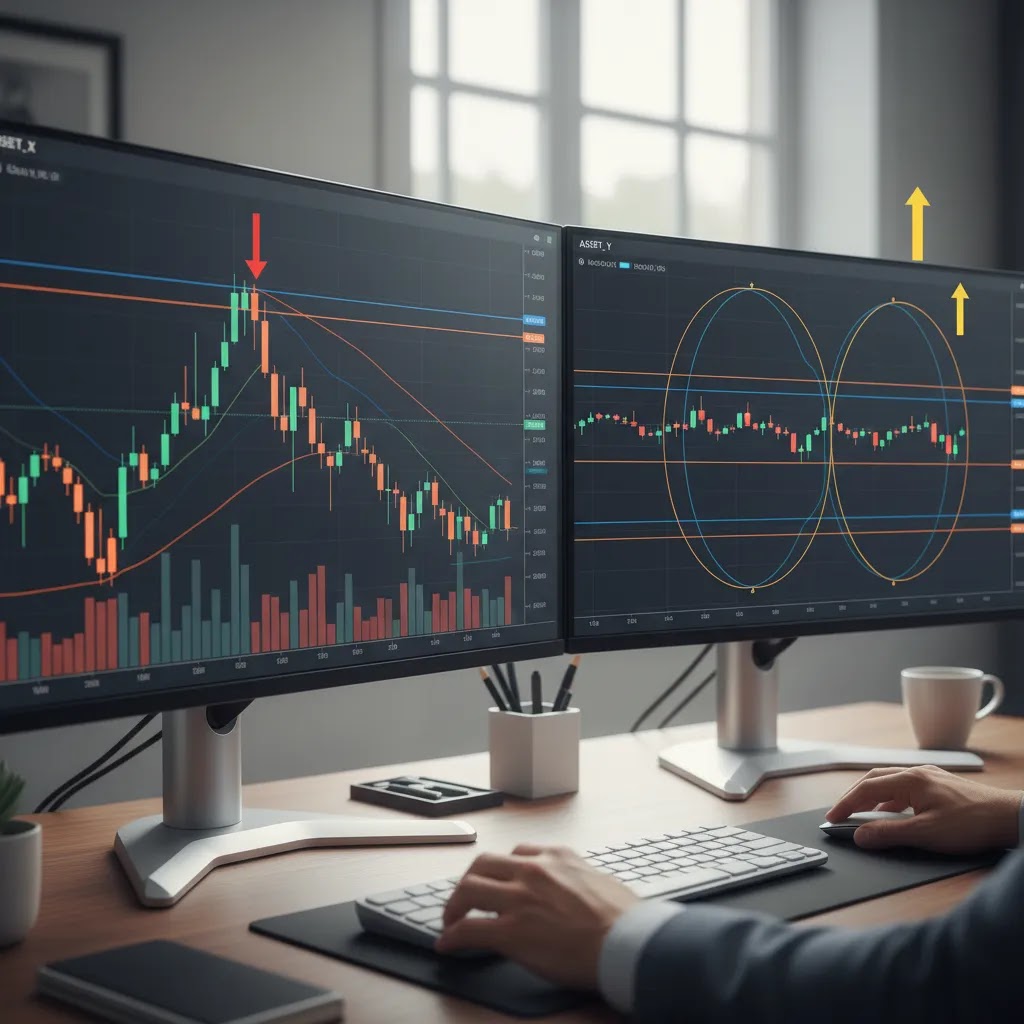
Bollinger Bands consist of three lines: a middle moving average and two outer bands that expand or contract with volatility. Two main uses: mean reversion (price touches an outer band and pulls back) and breakout trading (narrow bands suggest compression and a potential volatility expansion).
A band touch during a strong trend may not mean reversal. A squeeze may also fail when volume is weak or price is near a well-defined support or resistance level. Many traders combine Bollinger Bands with price action or momentum filters before placing a contract.
Setup basics
- Chart timeframe: 5-minute or 15-minute
- Bollinger Bands: 20, 2
- Confirmation: candle rejection, trend bias, or support and resistance
- Expiry: often 1 to 3 candles beyond the entry timeframe
Shorter expiries can look attractive because results come quickly, but they may expose the trade to more random price noise. Some traders compare this setup with a MACD and RSI approach to see whether momentum agrees with the Bollinger signal.

Entry logic for Call and Put trades
Reversal setup (range-bound conditions):
- Call idea: Price reaches or briefly closes below the lower band, then prints a rejection candle and starts moving back inside.
- Put idea: Price reaches or briefly closes above the upper band, then prints a rejection candle and starts moving back inside.
- Filter: avoid entries when the middle band is sharply sloping in the opposite direction.
Squeeze breakout setup:
- Wait for the bands to narrow visibly.
- Watch for a strong candle close outside one band.
- Consider the trade only when recent structure supports that breakout direction.
- Use cautious expiry selection because some early breakouts retrace quickly.
Step-by-step walkthroughs
Reversal example:
- Start with a market not trending strongly; the middle band looks relatively flat.
- Price pushes into the upper band; candle closes at or just beyond it but shows rejection.
- Wait for the next candle to close back inside the bands.
- Check the middle band slope.
- Only after the close back inside, consider a Put with an expiry of 1 to 3 candles.
- Invalidation: if price closes outside the band again with a strong body, reversal logic is no longer the right fit.
Squeeze example:
- Identify a clear squeeze: bands narrow and candles cluster around the middle band.
- Mark recent structure boundaries.
- Wait for a decisive candle close outside one band.
- Confirm the breakout is not immediately rejected.
- Consider an expiry of 2 to 3 candles.
- Invalidation: if the next candle closes back into the middle of the squeeze range, the breakout thesis may be failing.
Filters that may improve signal quality
- Trend direction. Reversal signals against a strong trend may fail more often.
- Support and resistance. A lower-band bounce near real support may carry more weight.
- Candle quality. Long wicks, engulfing candles, or strong closes back inside.
- Session timing. Some assets behave differently during active vs quieter periods.
- News risk. Major economic releases can distort volatility.
Common mistakes on turbo expiries
- Band-walk fading in a trend. Fading the upper band while price is walking it in a strong trend can cause rapid losses.
- Misreading squeezes as certainty. A squeeze is not a promise of a breakout — it is low volatility.
- Execution and platform issues. Chart lag, late order placement, or small price feed differences can change whether a candle is inside or outside the band.
Break-even math
Break-even win rate by payout
| Payout | Break-even win rate |
|---|---|
| 70% | 58.8% |
| 80% | 55.6% |
| 90% | 52.6% |
Mean-reversion trading aims for many small wins; breakout trading has fewer opportunities and more false starts. Neither is automatically better.

Strengths and considerations
Strengths:
- Easy to read and available on most charting platforms.
- Supports both reversal and breakout logic.
- Helps with expiry planning because volatility is visible.
- Can impose discipline when combined with price structure.
Considerations:
- Outer-band touches do not automatically mean reversal.
- Very short expiries may turn reasonable setups into low-quality trades.
- News events may make Bollinger behaviour unstable.
- Using the indicator alone may produce too many weak signals.
How to choose a broker
- Charting depth and indicator flexibility. Adjustable timeframes and indicator application without lag.
- Demo account availability. May help validate timeframe, expiry, and asset choice.
- Withdrawal reliability and payment access. Funding and withdrawals should be practical for UAE traders.
- Regulation and safety signals. Regulation status should be verified, not assumed.
- Payout structure and expiry range. Available expiry lengths matter because the setup needs time to develop.
Frequently asked questions
Are Bollinger Bands useful for binary options? They may be useful for reading volatility and price stretching. Not a standalone solution.
What timeframe works for this approach? 5-minute or 15-minute charts may reduce some noise.
Can it be used for 60-second binary options? Yes, but risk may be significantly higher.
Does a band touch mean an entry? No. A band touch only shows price has moved away from the average by a volatility measure.
Is another indicator needed? Not always, but a second filter may improve discipline.
How should Bollinger Bands be used? Two main ways: mean reversion or breakouts.
What is the most successful binary options strategy? No single approach is consistently successful for all traders or conditions.
Key takeaways
- Bollinger Bands may help read volatility but do not guarantee direction.
- Works better when combined with price structure and expiry selection.
- Very short expiries can increase noise risk.
- Broker choice matters — chart quality, demo, execution, withdrawals, regulation.
Related reading
About the Author
Braden Chase is a trading specialist and former research specialist at Forex.com. He writes about market mechanics, trading instruments, and the regulatory landscape to help readers research financial markets with a clearer understanding of risk. Braden has previously served as a registered commodity futures representative for domestic and internationally-regulated brokerages. Articles are educational analysis and do not constitute investment advice. Binary options are high-risk speculative instruments and are not regulated in the UAE.