
Reading Candlestick Charts for Binary Options: Mechanics and Application (2026)


Capital is at risk. Candlestick charts visualise short-period price movement through structured representations of open, high, low, and close prices. Reading candlesticks effectively is foundational to technical analysis but does not change the documented retail-loss distribution. ASIC documented retail-loss rates of 74–80% across binary options retail clients including those using candlestick analysis.
Risk warning
The UAE Capital Market Authority (CMA, successor to the SCA from 1 January 2026 under Federal Decree-Laws 32 and 33 of 2025), the Dubai Financial Services Authority (DFSA), and the Financial Services Regulatory Authority (FSRA) of ADGM have not authorised any binary options broker for retail clients.
What candlestick charts represent
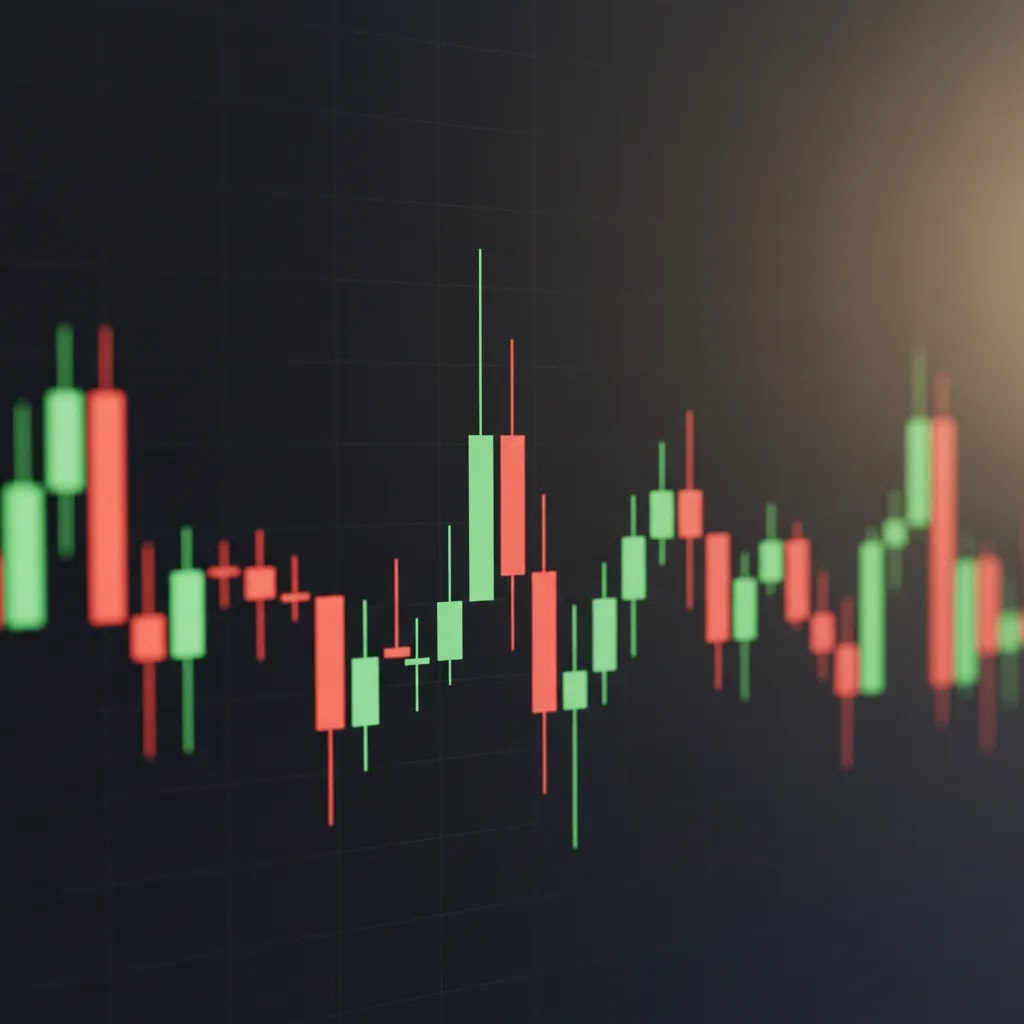
A candlestick chart displays price movement using vertical figures called candlesticks. Each candlestick represents one time period and contains four pieces of information: open price, close price, high price, and low price.
The structural elements:
- Body. The vertical rectangle spanning from open to close. Bullish candles (close above open) are typically green or white. Bearish candles are typically red or black.
- Upper wick. The line extending above the body to the period's high.
- Lower wick. The line extending below the body to the period's low.
Body size relative to wicks indicates the relationship between intra-period extremes and final settlement:
- Large body, small wicks: directional movement with limited reversal during the period
- Small body, long wicks: significant intra-period range with little net movement
- Body with one long wick: directional move with rejection at the wick's end
Reading a single candlestick
- Bullish candles (close above open): buyers controlled the period.
- Bearish candles (close below open): sellers controlled the period.
- Doji candles (close approximately equals open): indecision between buyers and sellers.
Reading wick lengths:
- Long upper wick. Price reached above the body's high but failed to hold. Typically indicates rejection — sellers entered at higher prices.
- Long lower wick. Price reached below the body's low but failed to hold. Typically indicates rejection — buyers entered at lower prices.
- Long upper and lower wicks (with small body). Significant indecision. Both buyers and sellers attempted to take control.
Single-candle interpretation provides preliminary information. The reliability of single-candle signals is bounded; pattern context (multi-candle interactions, level alignment, trend context) materially improves signal quality.
Why context matters more than patterns
The most important guidance: pattern recognition without context produces unreliable signals. The same pattern in different contexts has substantially different implications.
- Trend. A bullish reversal pattern in an established uptrend may be continuation (after pullback to support) or a less reliable counter-trend signal. Trend context determines which interpretation is more likely.
- Level. A bullish reversal pattern at established support has different implications from the same pattern in middle-of-range conditions.
- Confirmation. A pattern confirmed by subsequent price action carries more weight than an unconfirmed pattern.
- Timeframe. Higher timeframe patterns (4H, daily) are typically more reliable. Lower timeframe patterns (1M) are often dominated by noise.
- Volatility regime. Patterns in low-volatility conditions may be substantively different from patterns in high-volatility conditions.
Common candlestick patterns
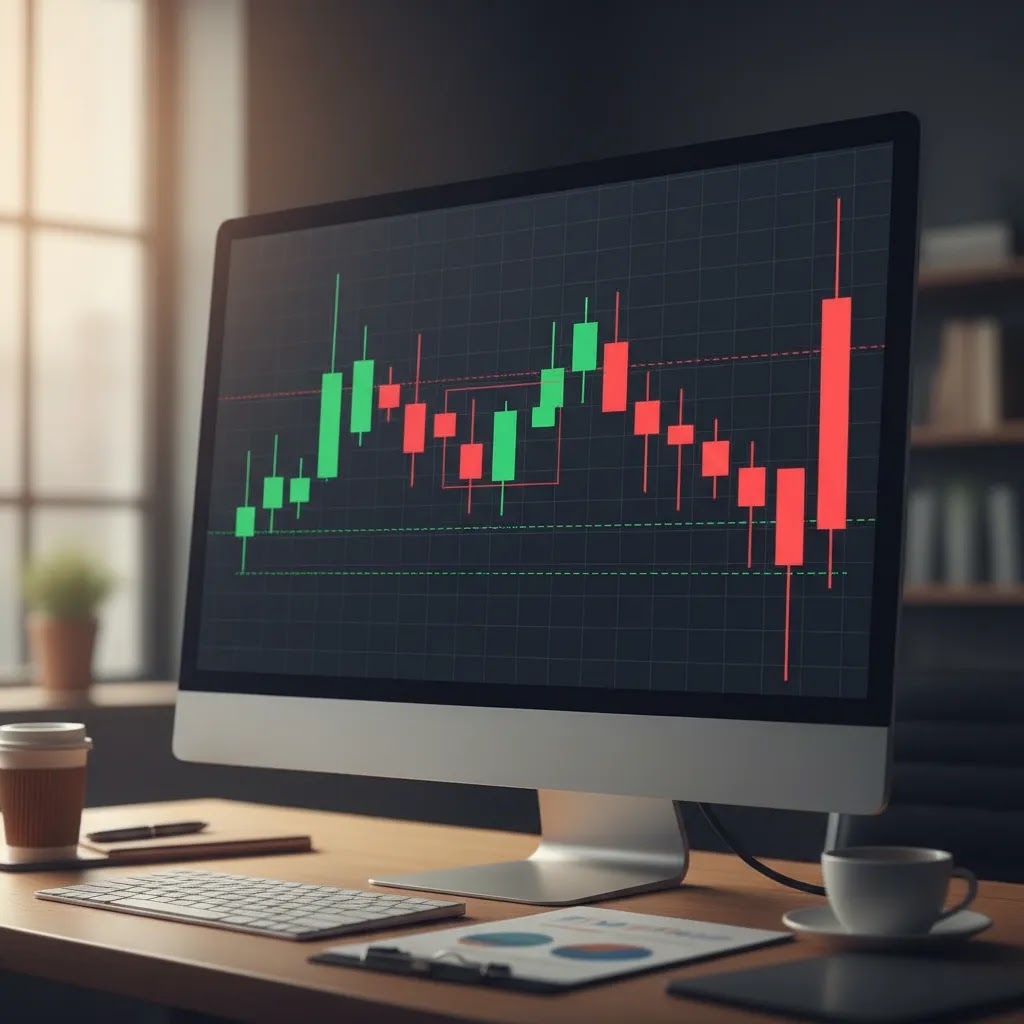
Doji. Single candle with very small body. Indecision between buyers and sellers. Variants: Long-Legged Doji, Dragonfly Doji (potential bullish reversal), Gravestone Doji (potential bearish reversal).
Hammer / Hanging Man. Single candle with small body and long lower wick. Hammer in downtrend at support is bullish reversal; Hanging Man in uptrend at resistance is bearish reversal.
Shooting Star / Inverted Hammer. Single candle with small body and long upper wick. Shooting Star in uptrend at resistance is bearish reversal; Inverted Hammer in downtrend at support is bullish reversal (with confirmation).
Engulfing patterns. Two-candle pattern where the second candle's body completely engulfs the first candle's body in the opposite direction. Higher reliability than single-candle patterns.
Inside Bar. Two-candle pattern where the second candle is "inside" the first. Compression / consolidation; pre-breakout pattern.
Three Soldiers / Three Crows. Three consecutive candles in the same direction. Sustained directional momentum; continuation signal in established trend.
Focus on these 6–7 patterns during initial learning. Deep familiarity with a small set of patterns produces better outcomes than superficial familiarity with 20+ patterns. Detailed treatment at Candlestick Patterns.
Candlestick patterns vs indicators
- Patterns are leading; indicators typically lag. Candlestick patterns describe current price behaviour; indicators describe past behaviour smoothed or transformed.
- Indicator confirmation may be redundant. Multiple indicators on the same chart, all derived from the same price data, do not provide independent confirmation.
- Independent confirmation comes from different inputs. Different timeframes, different methodologies, different time-windows.
- Indicators useful for context, not signals. Pattern-based signals combined with indicator-based context tend to outperform indicator-based signals.

Timeframes and expiry alignment
Recommended chart timeframe and expiry alignment
| Chart timeframe | Recommended expiry |
|---|---|
| 1-minute | 1–3 minutes (high noise; generally inadvisable) |
| 5-minute | 15–30 minutes |
| 15-minute | 30 minutes – 1 hour |
| 1-hour | 1–4 hours |
| 4-hour | 4 hours – 1 day |
| Daily | 1–3 days |
A candlestick pattern on a 5-minute chart is meaningful within a 5-minute timescale. The pattern's directional implication typically plays out over the next 1–3 candles. A binary options contract with 30-second expiry resolves before the pattern's implication can materialise; the contract is dominated by intra-period noise.
Break-even mathematics
Break-even win rate by realised payout
| Realised average payout | Break-even win rate required |
|---|---|
| 70% | 58.8% |
| 75% | 57.1% |
| 80% | 55.6% |
| 85% | 54.1% |
| 90% | 52.6% |
A pattern with 65% win rate at appropriate context produces a profitable approach at typical retail payouts. A pattern with 56% win rate produces marginal profit. A pattern with 50% win rate produces structural loss. Pattern recognition without empirical reliability documentation is not yet a viable approach.
Frequently asked questions
Are candlestick charts better than line charts for binary options? Candlestick charts provide more information density (full OHLC vs. closing prices only). Most retail technical analysis uses candlesticks.
Can a single candlestick pattern reliably predict the next price move? No. Single-candle patterns provide preliminary signals; reliability depends heavily on context.
Which candlestick patterns should UAE beginners start with? Doji, Hammer/Hanging Man, Shooting Star/Inverted Hammer, Bullish/Bearish Engulfing, Inside Bar, Three Soldiers/Three Crows. Deep familiarity with these 6–7 patterns produces better outcomes than superficial familiarity with 20+.
Why do candlestick signals fail on short expiries? Short expiries (under 5 minutes) are dominated by random price variation. Even genuinely informed analysis frequently produces incorrect outcomes because variance overwhelms the analytical signal.
What is the "3 candle rule"? Common interpretations: wait for 3 candles to confirm a pattern; look for 3 consecutive same-direction candles; use 3-candle reversal patterns. The substantive value is in waiting for confirmation.
Should UAE residents trade live as soon as they understand candlesticks? No. Read educational material, demo trade for 4–8 weeks, document 200+ trades, compare to break-even threshold, then small first deposit. The progression takes 3–6 months minimum.
Final risk warning
Candlestick analysis applied to binary options is foundational but bounded by the structural break-even mathematics. ASIC documented retail-loss rates of 74–80% across retail clients including those proficient in candlestick analysis. Capital is at risk and total loss of deposit is a frequent outcome.
About the Author
Braden Chase is a trading specialist and former research specialist at Forex.com. He writes about market mechanics, trading instruments, and the regulatory landscape to help readers research financial markets with a clearer understanding of risk. Braden has previously served as a registered commodity futures representative for domestic and internationally-regulated brokerages. Articles are educational analysis and do not constitute investment advice. Binary options are high-risk speculative instruments and are not regulated in the UAE.