
Binary Options Charts: Reading and Interpreting Price Action (2026)


Capital is at risk. Charts visualise price movement; they do not predict it. The substantive question is whether chart analysis improves the trader's win rate above the break-even threshold determined by the broker's payout. ASIC documented retail-loss rates of 74–80% across binary options retail clients — the figure includes traders using technical analysis as well as those not.
Risk warning
The UAE Capital Market Authority (CMA, successor to the SCA from 1 January 2026 under Federal Decree-Laws 32 and 33 of 2025), the Dubai Financial Services Authority (DFSA), and the Financial Services Regulatory Authority (FSRA) of ADGM have not authorised any binary options broker for retail clients.
What charts represent and what they do not
A price chart is a visual representation of historical price data for an underlying asset. The chart visualises direction, magnitude, frequency, and timing of price movements, plus levels at which price has historically reacted.
What charts do not directly show:
- Future price movement
- Order flow at the displayed price levels
- The reasons price moved (news, large trader activity, algorithmic flow)
- The probability that historical patterns will repeat
Chart analysis identifies historical patterns and uses them to inform probabilistic estimates of future behaviour. The estimates are inherently uncertain. Even the strongest historical patterns produce different outcomes in different instances.
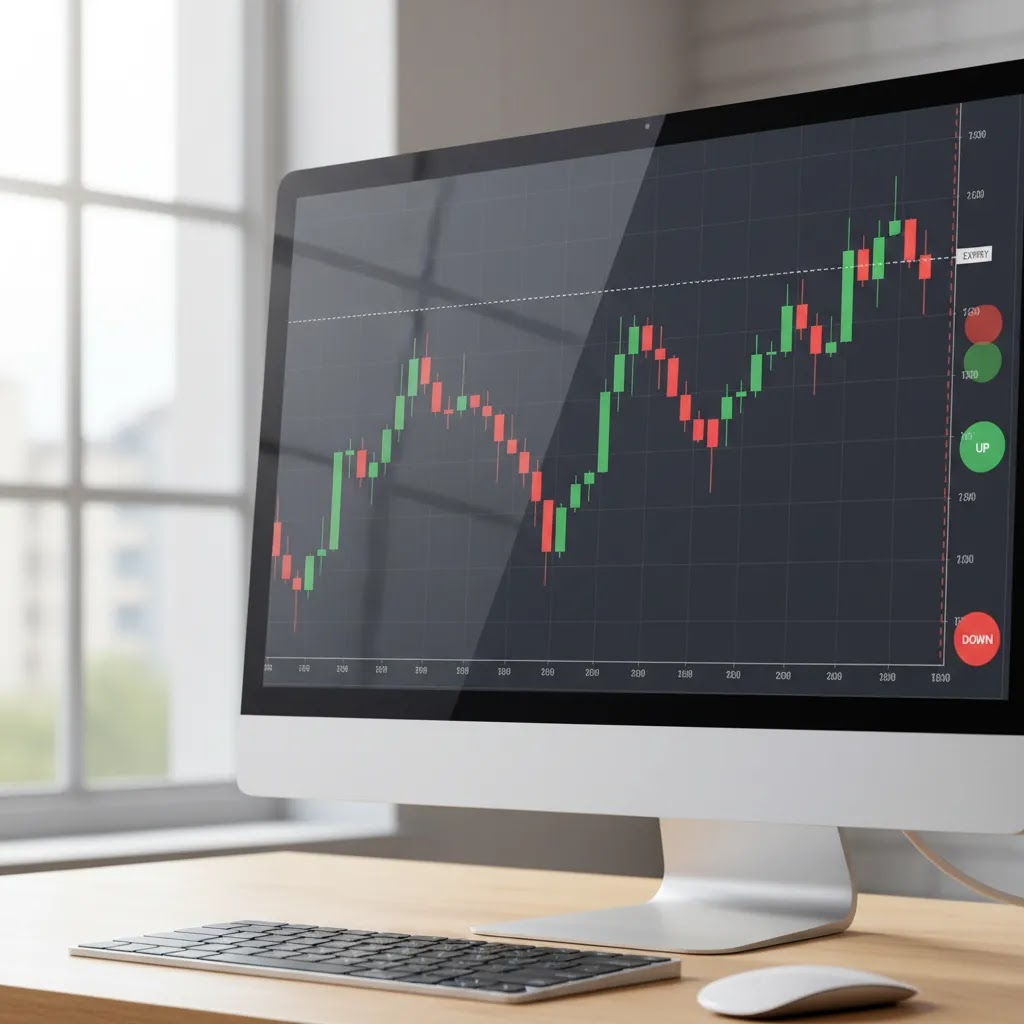
Strike price, expiry, and settlement — the chart's role
- Strike price. The price level against which the contract settles. Often the underlying asset's price at the moment of trade entry.
- Expiry timestamp. The exact moment when the contract settles.
- Settlement price. The underlying asset's price at the expiry timestamp, as recorded by the broker.
Practical implications:
- Settlement-moment volatility matters. A chart showing strong directional movement does not guarantee continuation through the expiry timestamp.
- Strike level should be visible during analysis. Most platforms display the strike line on the chart after trade entry.
- Settlement methodology should be understood. Different brokers may produce different settlement prices for the same underlying market.
- Chart-broker pricing alignment matters. Persistent gaps between broker pricing and external pricing warrant evaluation.
Chart types — line, bar, candlestick
Comparison
| Feature | Line | Bar | Candlestick |
|---|---|---|---|
| Information density | Low | High | High |
| Visual readability | High | Moderate | High |
| Pattern recognition | Limited | Possible | Easier |
| Beginner friendliness | Easy | Less intuitive | Moderate |
| Standard retail usage | Limited | Limited | Most common |
Candlestick charts are the most common retail format because they combine information density with visual readability. Detailed treatment at Reading Candlestick Charts for Binary Options.

Price action analysis — the structural framework
- Identify market structure. Higher highs and higher lows (uptrend), lower highs and lower lows (downtrend), or roughly similar highs and lows (range/sideways).
- Identify key levels. Support and resistance areas, recent swing highs and lows, round-number levels, significant historical pivots, moving average levels.
- Observe price behaviour at levels. Strong rejection (long wicks) suggests level is holding; failed rejection followed by breakthrough suggests level may break.
- Form directional view. "Likely to continue downward toward [next support]"; "likely to bounce from [current support]"; "likely to break through [resistance] if confirmation occurs."
- Match contract to view. Direction (call/put), expiry length appropriate to the view's timeframe, strike level reflecting the view.
- Verify against multiple timeframes. Higher timeframes provide trend context; lower timeframes provide refinement but introduce noise.
Timeframe selection
- Very short (1-minute). High noise, low reliability. Generally inappropriate for analytical reasoning.
- Short (5–15 minutes). Balance between noise and structure. Common starting point for retail analysis.
- Medium (30 minutes – 1 hour). Better connection to fundamental factors. Suitable for analytical reasoning.
- Higher (4 hours – daily). Strong structural information. Useful for context.
Common alignments: 5-minute chart → 15–30 minute expiries; 15-minute chart → 30-minute to 1-hour expiries; 1-hour chart → 1–4 hour expiries.
Indicators — supplementary tools
- Moving averages (MA). Smoothed average of price over a specified period. Common periods: 20, 50, 100, 200.
- Relative Strength Index (RSI). Momentum oscillator scaled 0–100. Above 70: overbought; below 30: oversold.
- MACD. Compares two moving averages to identify momentum changes.
- Bollinger Bands. Plots a moving average with upper and lower bands at specified standard deviations.
- Volume. Number of trades or shares traded. For forex, tick volume serves as proxy.
Indicators are derived from price; they do not provide information independent of price. The decision-making is still about price. Indicator overload (4+ indicators) typically degrades rather than improves decision quality.
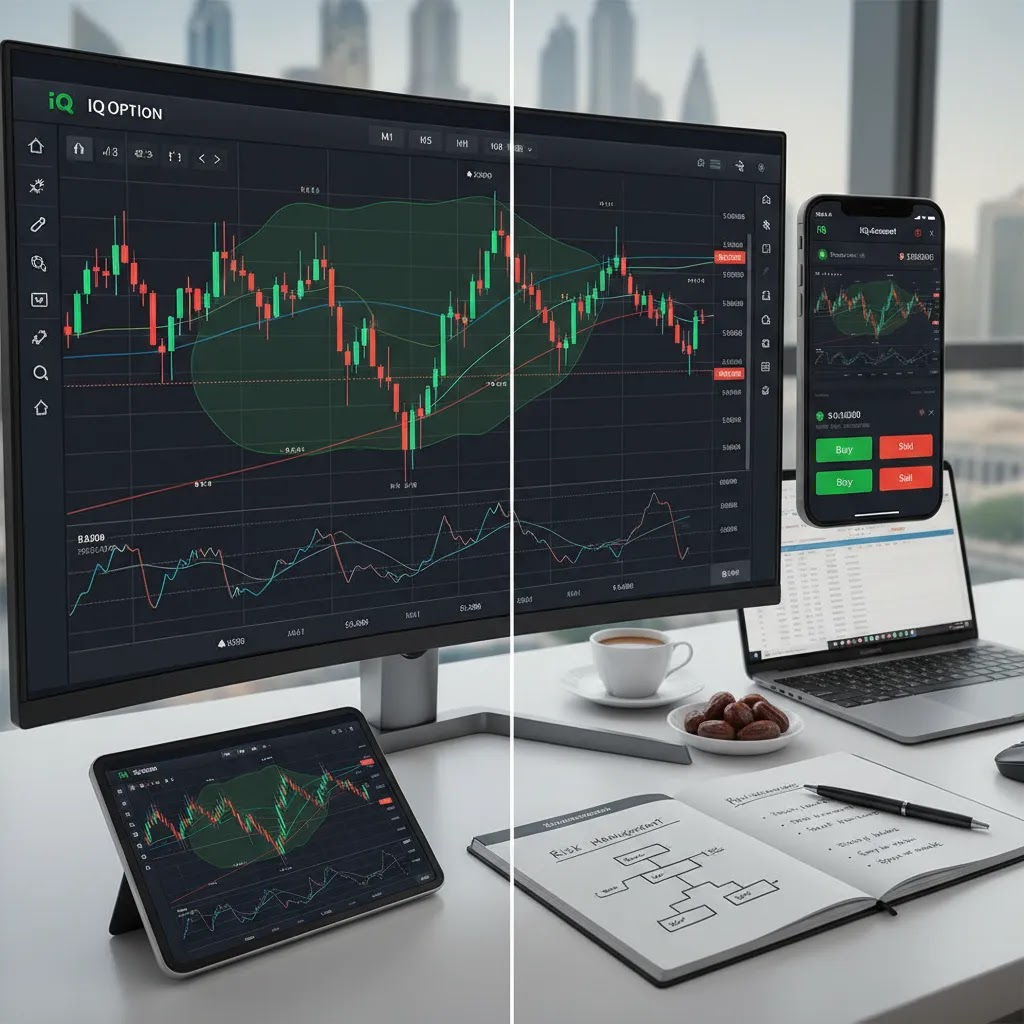
Charting platform evaluation
- Chart types available. Candlestick, bar, line, ideally Heikin-Ashi.
- Timeframes available. From 1-minute through monthly with intermediate options.
- Indicators available. 50+ standard indicators is typical. Quality matters more than quantity.
- Drawing tools. Trendlines, horizontal lines, Fibonacci levels, channels, rectangles.
- Multi-timeframe display. Ability to view multiple timeframes simultaneously.
- Data quality. Price feed should match external sources within reasonable tolerance.
- Performance. Chart should respond quickly to user inputs.
- Mobile capability. For UAE residents trading during work hours.
Using charts as a broker safety check
- Price feed consistency. Compare to multiple external sources. Persistent material differences may indicate data quality issues.
- Settlement methodology transparency. The broker should document how settlement price is determined at expiry.
- Strike line display. Strike level should be clearly displayed on the chart after trade entry.
- Expiry countdown accuracy. Should match the actual expiry timestamp.
- Chart-result alignment. Verify that the chart price at expiry matched the broker's claimed settlement price.
- Historical data availability. Sufficient historical data for analytical work.
Common chart-reading errors
- Single-candle decisions. Treating individual candles as definitive signals without context.
- Ignoring timeframe alignment. Reading patterns on one timeframe without verifying against higher timeframes.
- Confirmation bias. Identifying patterns that confirm pre-existing directional bias.
- Indicator over-reliance. Replacing price action analysis with indicator-based reasoning.
- Ignoring news context. Trading purely on chart patterns without awareness of upcoming news events.
- Pattern interpretation creep. Loosening pattern criteria to include marginal cases.
- Lack of documentation. Trading without documenting which patterns produce which outcomes empirically.
Frequently asked questions
What is the best chart type for binary options trading? Candlestick charts are the most common retail format because they combine information density with visual readability.
How do UAE residents read candlestick charts? Read candlesticks in context: trend, level (proximity to support/resistance), confirmation. Single candles provide weak signals; pattern clusters in context are more meaningful.
Why might my broker's chart prices differ from external chart sources? Different brokers use different liquidity providers and price feed sources. Small differences are normal. Persistent material differences may indicate operational concerns.
Should beginners use 1-minute charts? Generally no. 1-minute charts are dominated by noise. Beginners should start with 5–15 minute charts paired with 30-minute expiries.
What chart features should UAE residents prioritise in broker selection? Beyond chart features, prioritise regulatory standing, operational reliability, capital adequacy. The hierarchy is: regulatory standing → operational reliability → withdrawal mechanics → platform quality.
Final risk warning
Chart analysis applied to binary options trading is one component of a comprehensive approach. The structural break-even mathematics are not changed by improved chart-reading skill. Capital is at risk and total loss of deposit is a frequent outcome.
About the Author
Braden Chase is a trading specialist and former research specialist at Forex.com. He writes about market mechanics, trading instruments, and the regulatory landscape to help readers research financial markets with a clearer understanding of risk. Braden has previously served as a registered commodity futures representative for domestic and internationally-regulated brokerages. Articles are educational analysis and do not constitute investment advice. Binary options are high-risk speculative instruments and are not regulated in the UAE.