
Support and Resistance for Binary Options: Identifying Reaction Zones (2026)


Capital is at risk. Support and resistance levels are price zones where historical reactions have occurred. They are probabilistic indicators, not predictive ones. Identifying levels effectively is foundational to technical analysis but does not change the documented retail-loss distribution. ASIC documented retail-loss rates of 74–80% across binary options retail clients including those proficient in level identification.
Risk warning
The UAE Capital Market Authority (CMA, successor to the SCA from 1 January 2026 under Federal Decree-Laws 32 and 33 of 2025), the Dubai Financial Services Authority (DFSA), and the Financial Services Regulatory Authority (FSRA) of ADGM have not authorised any binary options broker for retail clients. Support and resistance analysis applied to binary options does not change the structural break-even mathematics.
What support and resistance represent
Support is a price area where historical buying pressure has stopped or slowed price declines. Support levels typically sit below current price.
Resistance is a price area where historical selling pressure has stopped or slowed price advances. Resistance levels typically sit above current price.
Why these reactions occur:
- Trader memory. Traders remember where price reversed previously and place orders at similar levels.
- Round-number psychology. Round numbers (1.0000, 1.5000, 100.00) attract attention and aggregated order flow.
- Previous swing extremes. Swing highs and swing lows from earlier price action attract subsequent reaction.
- Institutional levels. Levels at which major participants have historically taken positions tend to remain relevant.
- Technical levels. Moving averages, Fibonacci levels, and other calculated levels generate aggregated trader attention.
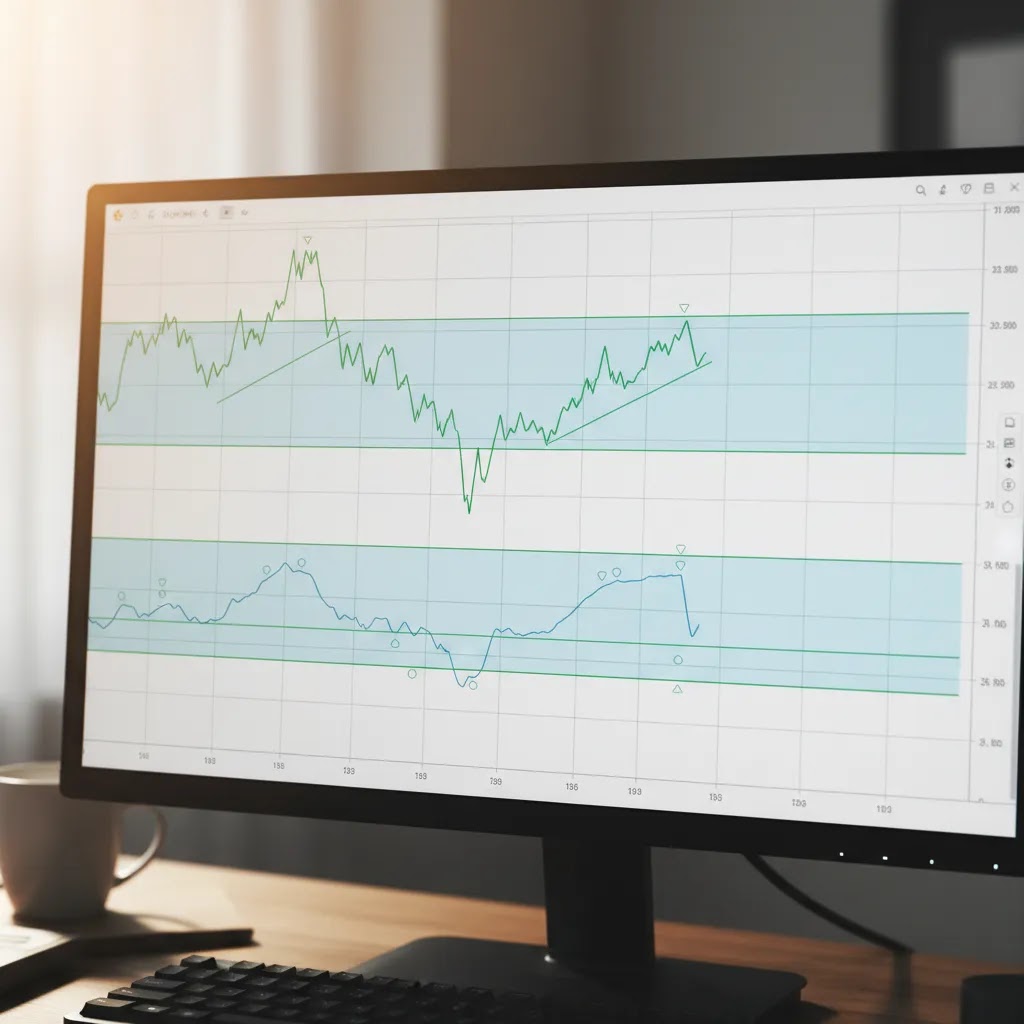
Reaction zones, not exact lines. Support and resistance are typically zones rather than precise prices. The width depends on volatility, time scale, liquidity, and recent price action. Treating levels as precise lines often produces missed reactions or false-break confusion.
Common types of levels:
- Horizontal levels: drawn at specific prices, typically at swing highs and swing lows. Most common type.
- Dynamic levels: moving averages and trend lines. Adjust as price evolves.
- Psychological levels: round numbers (00, 50, 100, 1000).
- Polarity levels: former resistance becomes support after breakout, or former support becomes resistance after breakdown.
- Pivot levels: calculated daily, weekly, or monthly pivots based on prior period's high, low, and close.
Why levels matter for binary options
When price approaches established support or resistance, the trader can anticipate three possibilities: reaction (level holds, price reverses), breakthrough (level fails, price continues), or consolidation (price pauses near level).
Probabilistic distribution informed by:
- Strength of the level (more tested, more reliable)
- Trend direction (counter-trend reactions are less reliable than trend-aligned reactions)
- Approach speed (slow approach often produces consolidation; fast approach often produces clean reaction or breakthrough)
- Surrounding levels (nearby levels affect interpretation)
Setup formation at levels. Specific patterns at levels increase analytical confidence:
- Bullish reversal patterns (Hammer, Bullish Engulfing) at established support
- Bearish reversal patterns (Shooting Star, Bearish Engulfing) at established resistance
- Failed breakouts followed by reversal (false break and return)
- Multi-touch reactions confirming the level
Trade timing relative to levels: the expiry length should align with the timeframe over which the level's reaction is expected to develop. A level identified on a 1-hour chart implies a reaction over the next 1–3 hours, not over 30 seconds. Detailed treatment at Support and Resistance Strategies.
Drawing levels — the technical process
- Start with a clean chart. Remove most indicators. Indicators add visual complexity that can obscure level identification.
- Zoom out for broader perspective. Identify levels on a higher timeframe first (4-hour or daily for forex; daily or weekly for equities).
- Mark obvious swing extremes. Visible swing highs and swing lows.
- Identify levels with multiple touches. Single-touch levels are weak; 2–3 touch levels are moderate; 4+ touch levels are strong.
- Draw zones, not lines. Mark levels as zones (typically 1–5 pips wide on forex pairs, 0.5–2% wide on equities).
- Identify polarity (role reversal) levels. Levels that were previously resistance and have become support (or vice versa) often retain significance.
- Verify across multiple timeframes. A level visible on multiple timeframes is more significant than one visible on a single timeframe.
- Document level rationale. Note why each level is marked.
- Limit total levels marked. Typically 3–5 levels at any given time. More levels obscure clear analytical decisions.
- Update levels as market evolves. New swing extremes create new levels; old levels may lose relevance after breakthrough.

Common errors in level identification
- Excessive level marking. Drawing levels at every minor swing produces a cluttered chart.
- False-precision interpretation. Treating levels as exact lines. Markets typically react in zones.
- Insufficient testing for level strength. Treating single-touch levels as reliable.
- Single-timeframe analysis. Identifying levels only on the trade timeframe without verification on higher timeframes.
- Ignoring trend context. Trading every level reaction regardless of trend.
- Excessive expectation of reversal. Levels also break through; expecting reversal in all cases produces consistent losses.
- Premature entry without confirmation. Entering at level approach rather than waiting for confirmation.
- Misalignment with expiry. Trading on a 1-hour-chart level with a 30-second binary options contract.
- Forced trading at every level. Selective trading is more profitable than reactive trading.
Using levels with expiry and risk
- Match expiry to level timeframe. 5-minute chart levels → 15–30 minute expiries; 15-minute chart levels → 30-minute to 1-hour expiries; 1-hour chart levels → 1–4 hour expiries.
- Wait for confirmation. Bullish/bearish engulfing at level; Hammer/Shooting Star at level; failed breakout (false break) at level; multi-touch confirmation.
- Position sizing. Pre-committed percentage sizing (1–2% per trade) regardless of confidence in the level.
- Trade selectively. Setups requiring multiple supporting elements occur infrequently. Selective trading on multi-element setups outperforms reactive trading.
- Document and review. Per-trade documentation supports empirical evaluation.
Break-even mathematics — the constraint
Break-even win rate by realised payout
| Realised average payout | Break-even win rate required |
|---|---|
| 70% | 58.8% |
| 75% | 57.1% |
| 80% | 55.6% |
| 85% | 54.1% |
| 90% | 52.6% |
For level-based trading to produce sustainable returns, realised win rate must exceed break-even by meaningful margin (3+ percentage points to allow for variance). Marginal level setups (single-touch, no pattern confirmation, weak trend context) typically produce win rates near 50% — below break-even at any retail payout.

A simple practice routine
- Read foundational material. This guide; Binary Options Charts; Binary Options Technical Analysis; Reading Candlestick Charts.
- Practice on historical charts. Identify levels on multiple timeframes. Mark zones (not lines). Verify across timeframes.
- Demo trade. Apply level-based analysis on demo account at intended broker.
- Document realised performance. After 200+ documented demo trades, compute aggregate win rate.
- Refine approach. Narrow focus to documented strengths.
- Evaluate continuation decision. Live trading proceeds only with documented data showing win rate above break-even threshold by meaningful margin.
- Live trading as continued evaluation. The demo phase only establishes that the approach can produce viable outcomes in absence of behavioural pressure.
The progression takes 3–6 months. Compressed timelines typically result in capital loss during the missed evaluation phases.
Frequently asked questions
Why are support and resistance useful for UAE residents new to trading? The structured analytical framework helps avoid mid-move entries. Approaching established levels with broader context provides analytical structure that random entries lack.
Do support and resistance work on 1-minute charts? They appear but are dominated by noise. Variance overwhelms analytical input at this timeframe. UAE residents should focus on 5–15 minute charts.
What is the most common error in level-based binary options trading? Excessive level marking and false-precision interpretation. Multi-touch zones with broader interpretation produce more reliable signals.
Can support and resistance be used without other indicators? Yes. Pure price-action analysis with support/resistance is methodologically valid.
Are binary options legal for UAE residents? Binary options are not specifically banned but are not authorised by the CMA, DFSA, or FSRA for retail clients. UAE residents trade through offshore brokers without UAE-resident investor compensation scheme protection.
Should UAE residents demo trade with support/resistance before live trading? Yes. The demo phase should run 4–8 weeks minimum with 200+ documented trades.
Final risk warning
Support and resistance analysis applied to binary options is foundational but bounded by structural break-even mathematics. ASIC documented retail-loss rates of 74–80%. Improving level identification skill is one component of a viable approach but does not change the underlying retail-outcome distribution. Capital is at risk and total loss of deposit is a frequent outcome.
About the Author
Braden Chase is a trading specialist and former research specialist at Forex.com. He writes about market mechanics, trading instruments, and the regulatory landscape to help readers research financial markets with a clearer understanding of risk. Braden has previously served as a registered commodity futures representative for domestic and internationally-regulated brokerages. Articles are educational analysis and do not constitute investment advice. Binary options are high-risk speculative instruments and are not regulated in the UAE.