
Binary Options Technical Analysis: Tools, Limitations, and Application Framework (2026)


Capital is at risk. Technical analysis applied to binary options is a structured method for forming probabilistic directional views from price-chart data. Its analytical value is real but bounded — ASIC documented retail-loss rates of 74–80% across binary options retail clients including those using technical analysis. Improving technical analysis skill is one component of a viable approach but does not change the structural break-even mathematics.
Risk warning
The UAE Capital Market Authority (CMA, successor to the SCA from 1 January 2026 under Federal Decree-Laws 32 and 33 of 2025), the Dubai Financial Services Authority (DFSA), and the Financial Services Regulatory Authority (FSRA) of ADGM have not authorised any binary options broker for retail clients.
What technical analysis means in binary options
Technical analysis is the study of historical price (and sometimes volume) data to identify patterns and form probabilistic estimates about future price movement. The framework rests on three premises: price reflects all available information, price moves in identifiable patterns that may persist, and history tends to repeat in the sense that similar conditions produce similar (probabilistic) outcomes.
For binary options specifically, technical analysis is applied to a fixed-payoff contract that resolves at a specific timestamp. The trader's question is binary: will price be above or below a strike at expiry? Technical analysis informs the directional view; the contract settles based on the actual price at the actual moment.
Distinction from other markets:
- In spot trading or CFDs, a directionally correct view that produces sustained price movement compounds favourably across the holding period
- In binary options, only the price at expiry matters
- A directionally correct view that fails to materialise within the expiry window produces a losing trade despite analytical accuracy
- Timing matters as much as direction
- Setup quality and timeframe alignment with expiry length are critical

Tools UAE residents should consider
1. Trend identification — moving averages
Moving averages smooth price data over specified periods, providing trend-direction information. Common periods: 20 (short-term), 50 (intermediate), 100, 200 (long-term).
For binary options, moving averages are appropriate as trend filters (do not trade against established trend) rather than as primary entry signals.
2. Momentum measurement — Relative Strength Index (RSI)
RSI is a momentum oscillator scaled 0–100. Above 70: overbought; below 30: oversold; crossings of 50: momentum direction changes. In strong trends, RSI can remain in extreme zones for extended periods.
3. Volatility measurement — Bollinger Bands
Bollinger Bands plot a moving average with upper and lower bands at typically two standard deviations. Identify volatility expansion (band widening) and contraction (band squeeze). Outer band touches are not reversal signals in trending conditions.
4. Pattern recognition — candlestick patterns
Engulfing, doji, hammer/hanging man, three soldiers/crows. Single-candle interpretation is unreliable; pattern reliability depends heavily on context. Detailed treatment at Reading Candlestick Charts for Binary Options.
5. Structural analysis — support and resistance
The most reliable analytical tool in technical analysis for binary options. More tested levels (3+ touches) are more reliable. Higher-timeframe levels carry more weight. Detailed treatment at Support and Resistance for Binary Options.
6. Combined frameworks — trend, level, momentum
The most commonly documented productive framework combines trend identification (moving averages or price structure), level identification (support and resistance), and momentum confirmation (RSI or candlestick pattern). A trade entry requires all three. The combination is more selective than any single component.
Why price action precedes indicators
Indicators are derivative tools — they are mathematical transformations of price data. The fundamental information is in the price itself; indicators provide secondary perspectives.
Core skills to develop first:
- Trend identification. Higher highs and higher lows (uptrend), lower highs and lower lows (downtrend), or roughly horizontal swings (range).
- Level identification. Mark prices where the chart has historically reacted.
- Pattern recognition at levels. Observe how candlestick patterns develop at key levels.
- Multi-timeframe synthesis. Verify analytical views across multiple timeframes.
- Confirmation discipline. Wait for confirmation of patterns before entry rather than anticipating completion.
Timeframe and expiry alignment
Suggested alignment
| Chart timeframe | Suggested expiry length |
|---|---|
| 1-minute | 1–5 minutes (high noise; generally inadvisable) |
| 5-minute | 15–30 minutes |
| 15-minute | 30 minutes – 1 hour |
| 1-hour | 1–4 hours |
| 4-hour | 4 hours – 1 day |
Misaligned timeframes produce results inconsistent with analytical effort. Multi-timeframe analysis strengthens reliability: higher timeframe (1-hour) provides trend context; trade timeframe (15-minute) identifies setup; lower timeframe (5-minute) refines entry timing.
Break-even mathematics — the constraint
Break-even win rate by realised payout
| Realised average payout | Break-even win rate required |
|---|---|
| 70% | 58.8% |
| 75% | 57.1% |
| 80% | 55.6% |
| 85% | 54.1% |
| 90% | 52.6% |
For technical analysis to produce profitable outcomes, realised win rate must exceed the break-even threshold. Marginal signals (53% win rate at 80% payout, break-even 55.6%) produce 2.6% loss per trade on average. Selective entry to higher-probability setups is required.
Common patterns that degrade technical analysis quality
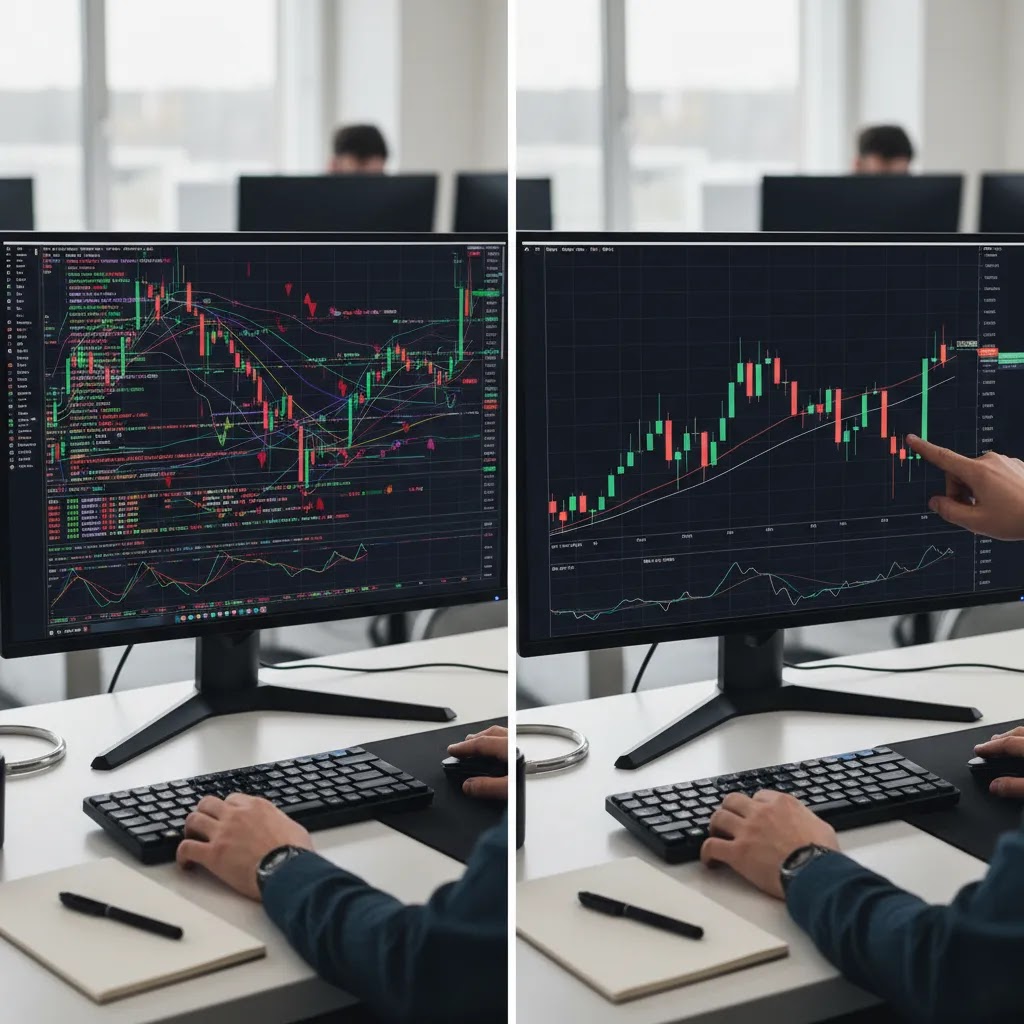
- Indicator overload. Adding many indicators creates analysis paralysis. Marginal value decreases rapidly past 1–2 indicators.
- Strategy-hopping. Switching strategies after losses without sufficient sample size to evaluate.
- Single-timeframe analysis. Trading on one timeframe without verifying against higher timeframes.
- Confirmation bias. Identifying patterns that support pre-existing directional bias.
- Pattern interpretation creep. Loosening pattern criteria over time. Reduces reliability while increasing trade frequency.
- News-event ignoring. Trading purely on technical setups without awareness of fundamental events.
- Recent-result overreaction. Modifying analytical method based on recent wins or losses.
- Lack of empirical validation. Trading on belief that the approach should work rather than on documented data.

A simple beginner routine
- Pre-session preparation. Review economic calendar, open chart on selected asset and timeframe, apply pre-determined indicators, mark obvious support and resistance levels.
- Setup identification. Wait for price to approach a marked level. Verify trend direction. Verify momentum indicator. Verify expiry length aligns with trade timeframe.
- Trade entry. Verify all setup criteria are met (not approximated). Verify payout meets minimum threshold. Document trade with rationale before entry.
- During-trade observation. Allow contract to expire without intra-trade interference.
- Trade documentation. Date, time, asset, direction, stake, payout, expiry, setup rationale, outcome, balance, rule violation flag.
- Session end. Review trades placed against plan rules. Pre-commit to whether to trade tomorrow.
- Weekly review. Compare realised win rate to break-even threshold. Identify which setups, assets, timeframes produced best results.
- Monthly review. Comprehensive evaluation. Continuation decision based on documented data.
Frequently asked questions
Is technical analysis sufficient on its own for binary options trading? No. Position sizing discipline, broker selection, behavioural management, and operational discipline matter as much or more for typical outcomes.
Which indicator works best for UAE residents new to binary options? There is no single best indicator. Common starting combinations: 20-period EMA + 50-period EMA + RSI (14-period). The substantive question is which combination produces documented win rate above break-even threshold.
Can technical analysis be used on very short expiries? Generally not. Very short expiries (under 5 minutes) are dominated by random price variation.
Should beginners start with indicators or price action? Price action first. The fundamental information is in the price itself; indicators provide secondary perspectives.
Are binary options legal for UAE residents? Binary options are not specifically banned but are not authorised by the CMA, DFSA, or FSRA for retail clients. UAE residents trade through offshore brokers without UAE-resident investor compensation scheme protection.
Are binary options closer to gambling than investing? Binary options at offshore brokers are negative-expected-value games for typical retail traders (74–80% loss rate per ASIC). The product is structurally closer to gambling than to investing.
Final risk warning
Technical analysis applied to binary options is methodologically valid but bounded by the structural break-even mathematics. ASIC documented retail-loss rates of 74–80% including those using technical analysis. Capital is at risk and total loss of deposit is a frequent outcome.
About the Author
Braden Chase is a trading specialist and former research specialist at Forex.com. He writes about market mechanics, trading instruments, and the regulatory landscape to help readers research financial markets with a clearer understanding of risk. Braden has previously served as a registered commodity futures representative for domestic and internationally-regulated brokerages. Articles are educational analysis and do not constitute investment advice. Binary options are high-risk speculative instruments and are not regulated in the UAE.