
Binary Options Trendlines for Beginners (2026)


Risk warning: Binary options are high-risk speculative instruments. Not regulated in the UAE. Capital at risk.
Binary options trendlines are one of the simplest chart tools a new trader can learn, but they are also one of the easiest to misuse. Trendlines may help structure price action visually, identify directional bias, and improve timing, but they do not predict outcomes with certainty.
Risk warning
The CMA, DFSA, and FSRA have not authorised any binary options broker for retail clients. A trendline is a chart aid, not a trade signal, and improving chart-reading skill does not change the documented retail-loss outcomes.
What binary options trendlines actually show
A trendline is a diagonal line drawn across price highs or lows to show the general direction of market movement. In binary options, that visual structure may help with deciding whether the market is trending upward, trending downward, or moving sideways.
A trendline is only a charting aid. It does not guarantee that the next candle will continue in the same direction, and it should not be treated as a signal on its own. In practice, trendlines are most useful when they are combined with price rejection, candlestick structure, nearby support or resistance, and sensible expiry selection.
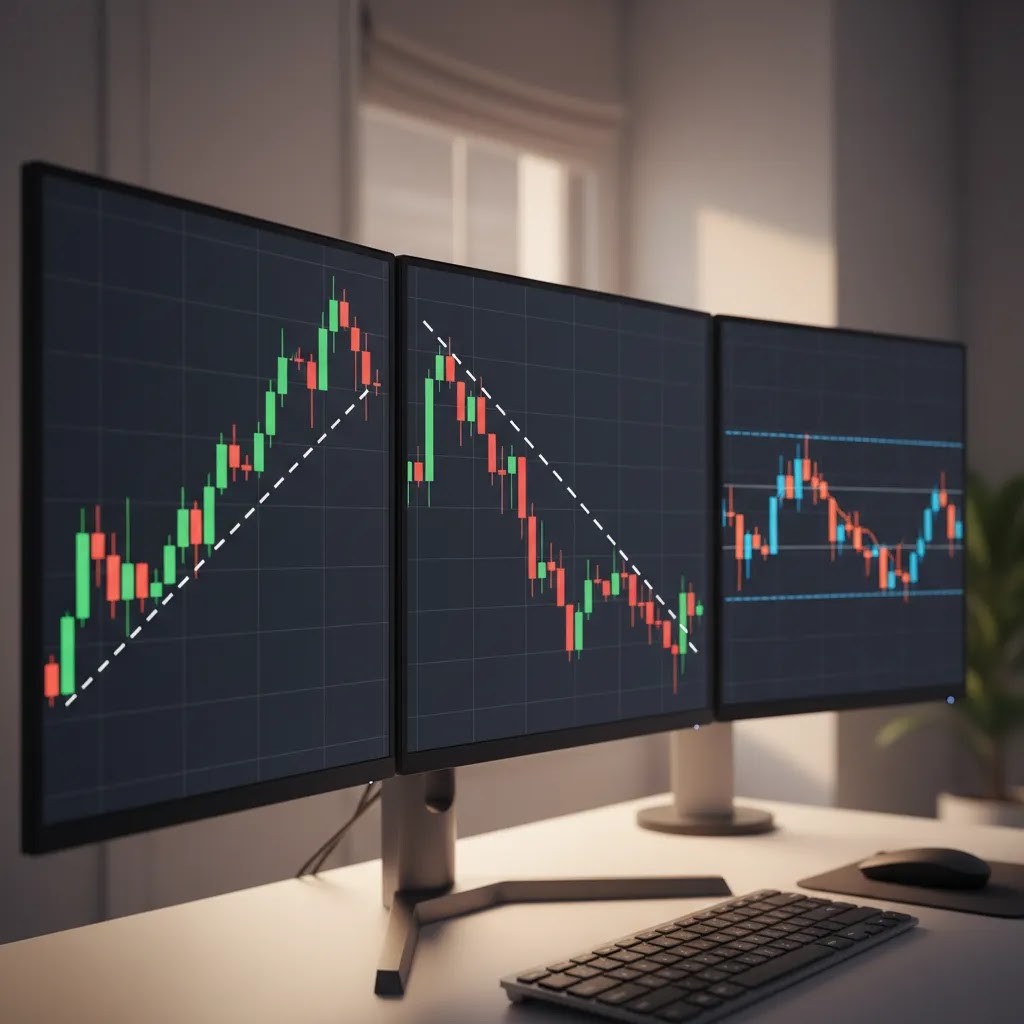
Types of trends and trendlines
- Uptrend. A typical rising trendline is drawn under price, connecting higher swing lows.
- Downtrend. A falling trendline over price connecting lower swing highs.
- Range. Better defined by horizontal boundaries, the "ceiling" and "floor" where price repeatedly stalls and reverses.
- Transition. The messy middle where an uptrend starts to lose strength, or a downtrend starts to base.
For binary options specifically, transition phases can be expensive because short expiries magnify false signals. Mislabelling a range as a trend, then treating every diagonal touch as meaningful, often increases whipsaws and makes timing errors more likely.
How to draw the best trend lines
- Start with obvious swing points. A line based on obvious swing lows or highs is usually more reliable than one based on random intraday movement.
- Do not force every wick to fit. A trendline is often an area of pressure rather than a mathematically exact boundary.
- Look for at least three touches. Two contact points create a line. A third touch gives it more practical relevance.
- Use the same timeframe for analysis and entry logic. Beginners usually do better when they analyse and execute with a clear timeframe relationship.

Beginners trading concepts using trendlines effectively
- Trend continuation setups. In a rising market, watch for price to pull back toward an upward trendline and then look for a bounce.
- Trendline break setups. Some traders use breaks of trendlines as an early sign that momentum is changing. Many false breaks occur, especially around volatile sessions.
- Trendlines with support and resistance. A trendline becomes more useful where it overlaps with horizontal levels.
- Trendlines and expiry selection. A trendline may help with direction, but direction alone is not enough. The market must also move within the option's expiry window.
4 things to know about trendlines
- Trendlines are interpretive, not objective. Two traders can draw slightly different lines on the same chart and both may be reasonable.
- Touches matter more than perfect precision. A line that captures the general path of price and gets multiple reactions may be more useful than one that looks neat.
- Trendlines work better with confirmation. Candlestick rejection, support and resistance, and cleaner market structure may strengthen the case.
- Short expiries can distort otherwise sound analysis. Even where the line is valid, the trade may expire before price responds.
Trendline "rules" beginners ask about (3-5-7 rule)
The 3-5-7 rule is commonly used as a shorthand for "structure and confirmation": a trend may be more trustworthy after multiple swings in the same direction can be identified, and a trendline may be more meaningful after several clean reactions rather than a single touch. It functions as a way to slow decision-making down, not as proof that a trendline will hold.
A trendline can be sanity-checked without relying on any single rule. Touch quality, spacing, slope, and cross-checks against a slightly higher timeframe all warrant verification.
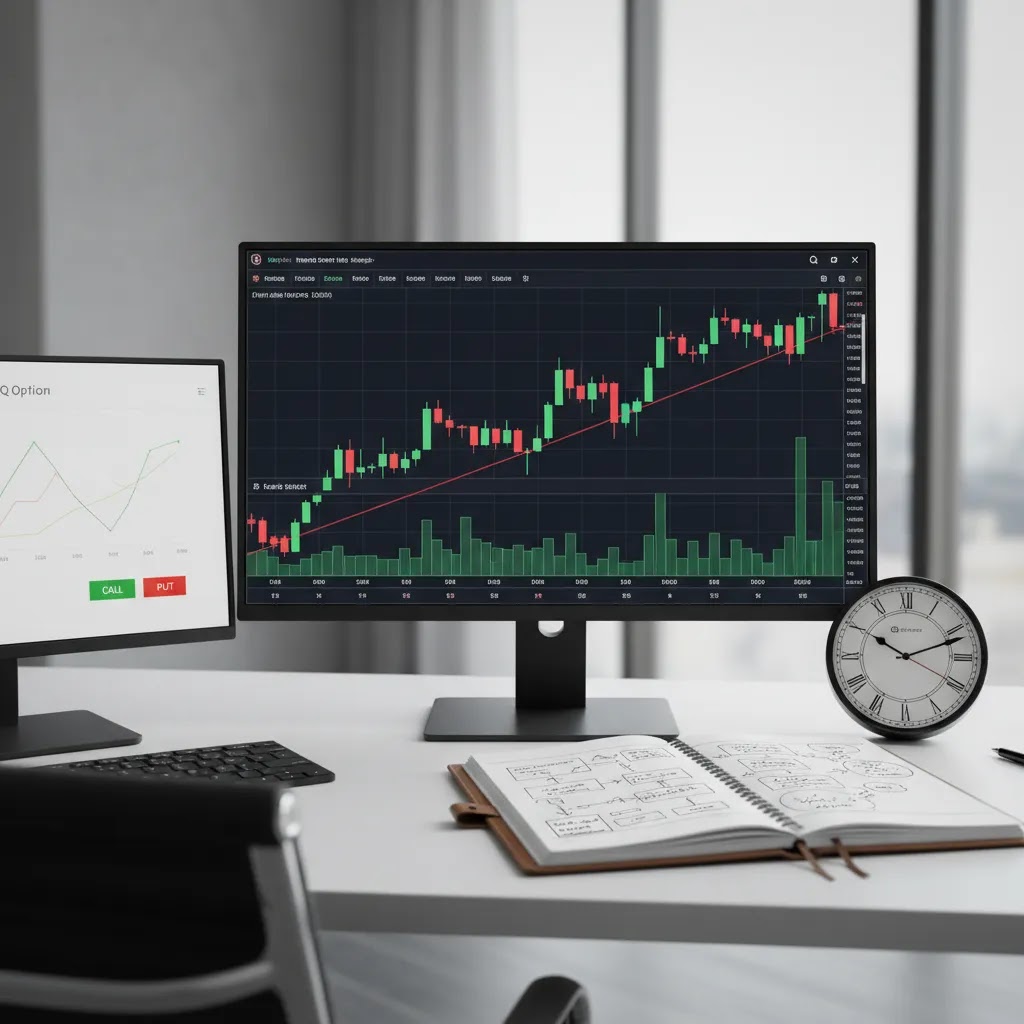
Trendlines vs other trading methods
In spot forex or stocks, a trader can typically manage a position as it develops. In binary options, the outcome is time-bound and fixed-return. The trader is not just trying to be "right" on direction; they are trying to be right within a specific window.
A small false break that might be manageable in another market can be decisive in binaries where the option expires during that noise. Breakouts also need to be thought about differently. Price can break a line briefly, then return, and the trade result depends on where the market is at the expiry moment.
What to look for in a broker if trendlines are used
- Chart clarity and timeframe controls. Charts must be readable and responsive.
- Demo account availability. Allows testing whether line placement is consistent.
- Withdrawal transparency. A major concern for UAE users.
- Regulation and safety signals. No binary options broker is authorised by the CMA, DFSA, or FSRA.
- Payout structure and expiry flexibility. A platform that offers only very short durations may not match the timeframe used in trendline work.
Frequently asked questions
Are binary options trendlines reliable for beginners? They may be useful as a visual framework, but they are not reliably predictive on their own.
How many touchpoints should a trendline have? Traders look for at least two points to draw the line and a third reaction to make it more meaningful.
Should trendlines be used on short timeframes? They can be, but lower timeframes usually contain more noise and more false breaks.
What is the biggest mistake beginners make with trendlines? Forcing the line to match a bias already held, or drawing from minor candle noise instead of clear swing points.
What is the 3 5 7 rule? Not a single official market rule; usually a heuristic traders use to describe "confirmation through structure."
What are the 4 types of trends? Uptrend, downtrend, range, and transition.
Do professional traders use trendlines? Many use trendlines or similar forms of market structure as a simple way to visualise direction, alongside other evidence rather than as a stand-alone signal.
Key takeaways
- Binary options trendlines may help beginners read direction more clearly, but they do not predict outcomes with certainty.
- The best trend lines are usually drawn through obvious swing points, not forced to fit every wick.
- Trendlines tend to work better when combined with support and resistance, candlestick context, and sensible expiry selection.
- Demo practice is strongly recommended before any trendline analysis is applied to a live binary options account.
Related reading
About the Author
Braden Chase is a trading specialist and former research specialist at Forex.com. He writes about market mechanics, trading instruments, and the regulatory landscape to help readers research financial markets with a clearer understanding of risk. Braden has previously served as a registered commodity futures representative for domestic and internationally-regulated brokerages. Articles are educational analysis and do not constitute investment advice. Binary options are high-risk speculative instruments and are not regulated in the UAE.